
The Great Stagnation
Seventeen years of unremarked crisis

On 3 March 2026, Rachel Reeves told the House of Commons that the OBR expected the UK economy to grow by 1.1% in 2026 and 1.6% in both 2027 and 2028. That sounded mediocre, not catastrophic. But that is exactly the problem. Those forecasts point to years 18 to 20 of a Great Stagnation that Britain has barely learned to name.
For this piece, I’ll define stagnation as a multi-year period in which real GDP per capita grows by less than 1% annually. By that standard, the UK has been stuck in an extraordinary slump since 2008 - one so long and so slow that it has been mistaken for normality.
Quick definitions for readers not comfortable with economic jargon: “real” growth means growth adjusted for inflation; GDP is the total output of the economy; GDP per capita is that output divided by the population, which makes it a better rough guide to whether a country is getting richer per person.
Two decades of flatlining
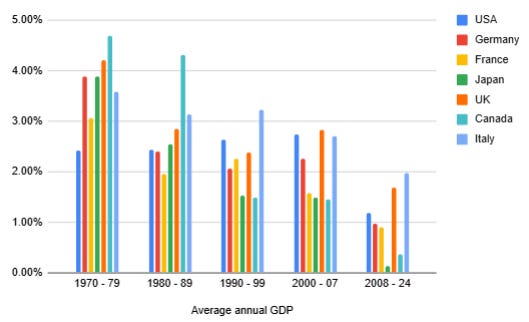
The story most people know is simple enough: in 2008, the financial crisis hit. Growth weakened. Then, just as things were beginning to recover, Covid hit and the economy took another blow. On the usual GDP numbers, that story is true as far as it goes. Across the G7, average annual GDP growth from 2008 to 2024 was markedly lower than in any of the earlier periods shown here. The post-2008 era was plainly weaker than the decades before it.
For the UK, 1.7% annual growth from 2008 to 2024 is poor by recent historical standards. It is well below the 2.8% seen in 2000-07, the 2.4% of the 1990s, and the 2.8% of the 1980s. But on its own, it still looks more like a disappointment than a national emergency.
This is because headline GDP still softens the truth. It gives the impression of an economy that kept moving, just more slowly than before. That is why this era has so often been described as disappointing rather than historic. The usual GDP numbers capture the slowdown. They do not yet capture the stagnation.
Let’s look at the per capita figures
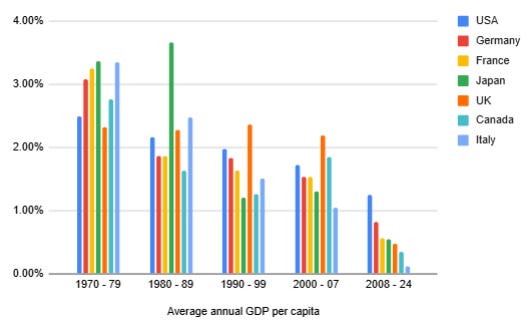
Once population growth is taken into account, the picture changes sharply. Across the G7, average annual GDP per capita growth from 2008 to 2024 was again lower than in any of the earlier periods shown here. But this time the scale of the decline is much clearer
For the UK, average annual GDP per capita growth fell to just 0.48%. Italy managed only 0.12%.
Only the USA stayed above 1%.
This is the real break. On a headline GDP basis, the post-2008 years look like a long period of weakness. On a per capita basis, they look like something much more serious: a sustained failure to make the average person meaningfully richer. That is why this period deserves to be called a stagnation.
Comparing GDP and GDP per capita directly for the post-2008 period reveals how much headline growth has flattered to deceive:
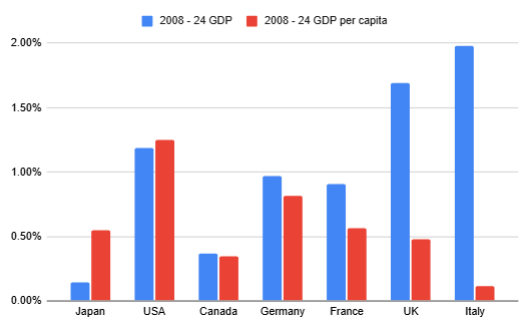
Japan’s weak headline GDP growth masks the fact that GDP per capita grew much faster, so individuals there did better than the aggregate numbers suggest.
In the USA and Canada, the two measures are roughly in-step; in Germany and France, headline GDP still flatters exaggerates per-person growth.
In the UK, the 1.7% annual GDP growth rate falls to under 0.5% on a per-person basis - completely inadequate for a country that expects rising living standards.
And Italy is even worse. There, almost all of the apparent growth in the aggregate figures disappears once population is taken into account.

The worst stagnation in British history?
The length of this period is what makes it so unusual. Since 1945, the UK has had bad years and bad runs, but not a 17-year stretch in which average real GDP per capita growth remained below 1%. That is what makes the post-2008 period different. It is not just weak, it is weak for an exceptionally long time. The post-war era was built around the assumption that living standards would keep rising at a decent pace. Since 2008, that assumption has broken down.
There are some possible historical comparisons, but none quite fits. One is the interwar period. Britain returned to growth after the early 1920s, but it was slow, uneven and accompanied by high unemployment and a wider sense of economic drift. The Productivity Institute notes that UK growth in the 1920s averaged only 1.4% a year, and that the period was marked more by “doldrums” than by any strong recovery. That is probably the closest modern analogue. But even that comparison is imperfect. Interwar Britain contained sharper shocks, more obvious social distress, and a more visibly abnormal economic environment than the one we have lived through since 2008. Even then, that 1.4% average is almost triple our current stagnation, and for a shorter period.
The other possible comparison is the Long Depression that began in 1873. But that too is only a partial match. The late 1800s brought deflation, financial instability and intense anxiety, yet historians still argue over whether it was really a depression in the modern sense at all. Some measures of output and even real income per head continued to rise. In other words, it felt grim, but it was not the same kind of long, per capita stagnation shown in the charts above.
The historical data gets shakier as you go further back, especially before 1900. But my search suggests that this is the longest clear British slump of its kind in at least the modern era, and quite possibly in the last 300 years, or longer. That should be a central fact of British politics. Politicians talk about productivity, investment, living standards and fiscal pressure as separate problems. They rarely describe the underlying condition plainly: Britain has endured an unparalleled long period of near-stagnation, and it is still not being addressed as such.
Why stagnation has been tolerated
As well as the unusual length of this crisis, it is markedly different for its subtle nature.
A country with 15% inflation knows it has a problem. A country with 10% unemployment knows it has a problem. Both create obvious pain, obvious headlines and obvious political pressure. Stagnation does not work like that. It arrives slowly. It spreads its damage across wages, tax revenues, public services, investment and personal expectations. It feels less like an emergency than like a general thinning-out. That is one reason Britain has tolerated it for so long. A crisis that comes as forgone growth is easier to ignore than one that comes as visible collapse.
In 2008, UK real GDP per capita stood at about $44,500 (using 2010 dollars for a stable marker). By 2024 it had risen to roughly $48,000. That is an increase of just 7.9% across sixteen years. If Britain had matched the US rate of real GDP per capita growth over the same period, it would have reached about $54,300 instead - a gap is roughly $6,300 per person. In other words, British output per head would be around 13% higher today if the UK had simply grown at the same per-person pace as the US since 2008.
And this points to the political illusion at the centre of the whole period. Britain reached $48,000 of GDP per head in 2024, and almost nobody treats that as an emergency. But imagine a different path. Imagine Britain had reached roughly $54,000 by 2020, then spent four years shrinking back to the same $48,000 endpoint. That would be treated as a national economic disaster. Ministers would be under intense pressure. The media would call it a crisis. There would be no shortage of demands for a new direction. The fact that we arrived at the same destination through years of weak growth rather than visible decline does not make the damage smaller. It only makes it less legible.
That is the real danger of stagnation. It does not look like a crisis, so it is not treated like one. It produces no single crash, no clean villain and no obvious moment of reckoning. Instead it creates a country that is permanently more strained than it should be, with weaker wage growth and lower ambition. Another five years of this would not feel dramatic in the moment. That is exactly why it would be so damaging.
Conclusion
The point of this essay is simply to make clear just how bad this problem has been, and how poorly it has been recognised. This is not just a British story. It is a wider G7 story, with the USA the main exception.
Across much of the rich world, the post-2008 period has been marked by extraordinarily weak growth in output per person, yet very few politicians speak about it with anything like the clarity it deserves. A crisis this large should have produced a new economic agenda. Instead it has mostly produced patchwork measures, modest reforms and evasive language.
Perhaps that is why so much hope is now being loaded onto AI. It is one of the few remaining ideas that promises growth without forcing governments to admit how poor the underlying record has been. If AI delivers a genuine productivity boom, it may change the picture completely. But if it does not, the emptiness of the current response will become much harder to hide. After nearly two decades of stagnation, much of the rich world is still governed by people who speak about low growth obliquely, timidly, or not at all.
Isn’t this just the classic Yookay problem (albeit clear to see it’s not just a UK problem in the “developed” world) that effectively we needed to take tough decisions in the years following 2008 that would have caused short term pain but would have led to long term gains (considering our energy mix in a braver way, training young people rather than funnelling them into university courses they probably couldn’t argue the cost benefit analysis for and loading them with significant debt in the process, challenging mass immigration and seeking new economic models not relying on ever suppressed wages/being willing to stand up the much repeated “you don’t like unlimited immigration therefore you must be racist” etc.), but no one had the bottle to do it. And as I’m sure any doctor will tell you, burying your head in the sand will only make the medicine required in the future that much heavier to return to good health. I believe we might have unfortunately crossed the point of no return.
GDP per worker working age adult would also be interesting, especially with Japan in the mix.